Earlier this year we wrote about how well Sage 200 integrates with MS Excel. From exporting filtered lists to the powerful Business Intelligence module, the integration gets better with every Sage 200 version release.
But even with these two features, and the multitude of built-in reports, there was an opportunity to give a little more!
Exporting your list views will give you a table of data to work with which is handy. But if you want to add some analysis and make it presentable then it’s going to take some time. You can export any of the built-in reports to Excel, but they too will only give you a table of data.
Business Intelligence, or ‘BI‘ as it’s commonly referred to, is a very powerful tool. You can slice-and-dice your data, interrogating your entire database and very quickly too. But, depending on what you need to see, this is where it can fall short. BI retrieves data from ‘Cubes’ which are snapshot images of your database. These Cubes are built in such a way that they capture the data in various dimensions.
This is what makes BI so powerful. But the Cubes need to be refreshed to capture new data from the database and this takes a fair amount of server resource. The larger your database, the longer the Cubes will take to refresh. Sage recommends a schedule to refresh the Cubes each day at 3am, or when the most resource is available on the server. At best your data will be one day old, and even older if the Cubes aren’t refreshed daily. So although BI is a brilliant tool, if you need today’s data then it might not be enough for you. This is where the new Sage 200 Excel Reporting may cover what you need to see.
Sage 200 Excel Reporting
2015 brought about the release of the Excel Reporting module.
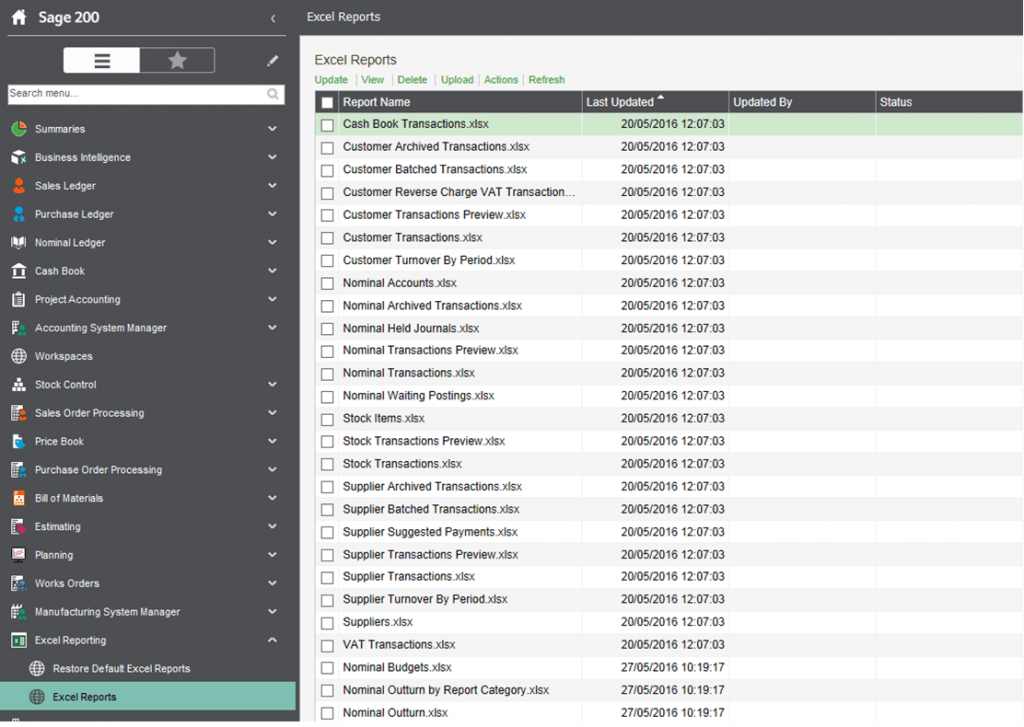
If you’re looking for a quick way to export your live data from Sage 200 into a workbook, and in a presentable format too, then the Excel Reporting module could be what you’re looking for.
Select a report and click Update, and within a few seconds the report status will update to confirm the data has refreshed…
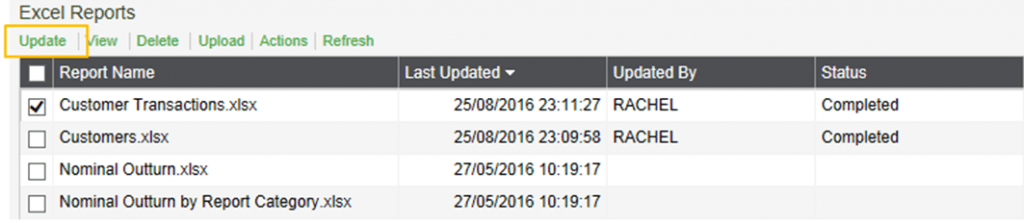
Select the report again, and select View to open the report in Excel.
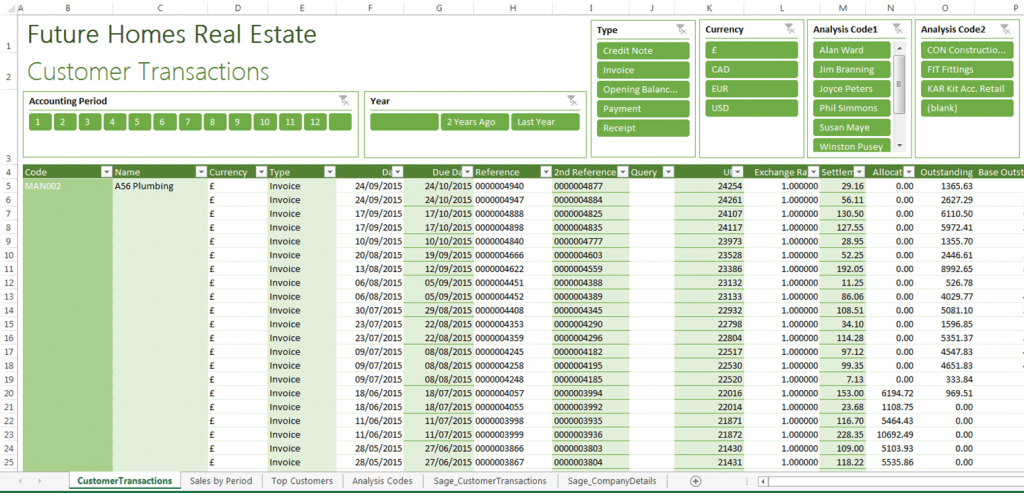
The data exports into a Workbook in a presentable report format. Various filters are visible on the report, making it more intuitive for recipients to understand what the data represents.
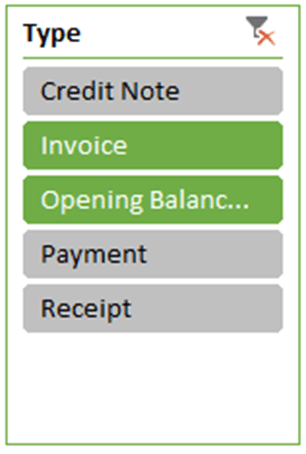
Activate or deactivate the filters by selecting any of the filter items.
Holding the ‘Ctrl’ key on your keyboard whilst selecting these items allows you to select more than one at a time
Excel Reporting - More than meets the eye!
Depending on the report you’ve chosen, various summaries and pieces of analysis are also available on the other Worksheets within the Workbook.
Again, filters are situated alongside the data or chart, allowing you to isolate and present what you need.
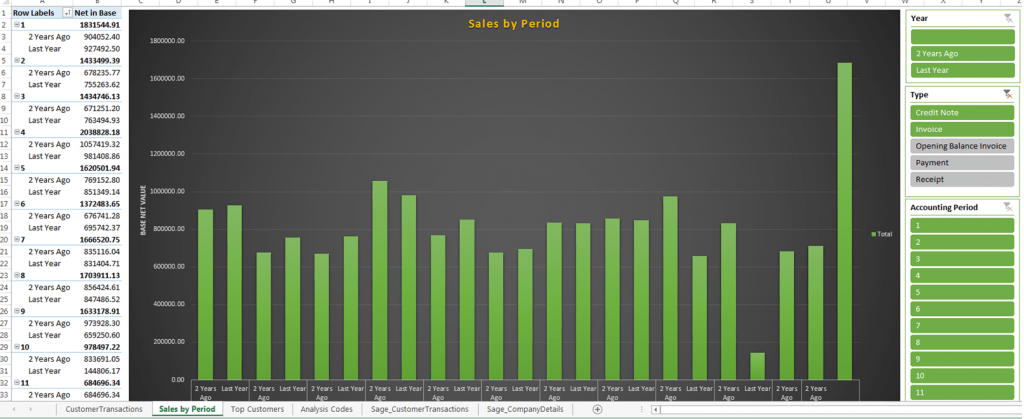
These filters are available on each of the data tables and charts. You can manipulate the report and get what you need from it in a matter of seconds, whilst keeping it in a presentable Report format.
There are more reasons now to upgrade your version of Sage 200 than ever before. If you’re on a pre-2015 version of Sage 200, ask your Accredited Business Partner to get you upgraded!
Keep an eye out for future blogs from AlphaLogix.
Our team of Accredited Sage 200 Product Specialists have many years of experience and are here to help, from initial consultation through to: development, implementation, training and on-going support.
If you would like any further information or a demonstration of Sage 200, please contact us:
Email: info@AlphaLogix.co.uk
Tel: 0845 259 3141
Request a Call Back to Discuss Sage 200.
• Organise a Personalised Demonstration of Sage 200
• Request Pricing or Organise a Quote

Kind Regards,
Richard Owens | Product Specialist